
 AMEX
AMEX Toronto
 Mexico
 Santiago
 Amsterdam (EuroNext)
 Dublin
 Frankfurt
 Helsinki
 IOB
IOB Moscow
 Oslo
Oslo Warsaw
 Stockholm
 Vienna
 Zurich
 Athens
 Milan
Milan Sydney
 Jakarta
 Dubai Financial Markets
 HongKong
 Istanbul
 Tokyo
Tokyo NSE
NSE Saudi Exchange
 Shanghai
 South Korea
 Stock Exchange of Thailand
 Taiwan
 Tel Aviv
 Quatar
 Johannesburg
Unlock the power of data-driven investing with our easy-to-use tool for analyzing the correlation between stocks. With just a few clicks, you can gain valuable insights into the relationship between any two stocks in your portfolio or the wider market. Whether you're a seasoned investor or just starting out, our tool provides the clarity and confidence you need to make informed investment decisions. Try it out today and start discovering the correlation between stocks like never before!
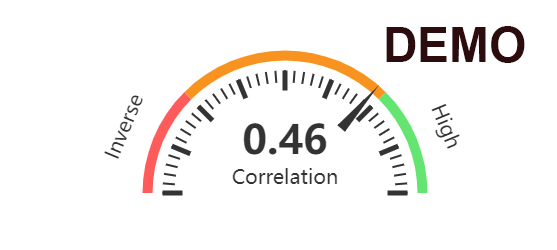
Hit the correlation button and we will give you some textual insights.
Did You Know?
Correlation is a statistical measure that describes the relationship between two variables. It ranges from -1 to 1, where -1 indicates a perfect negative correlation (as one variable increases, the other decreases), 1 indicates a perfect positive correlation (as one variable increases, the other increases), and 0 indicates no correlation (there is no relationship between the variables).
Correlation can be used to analyze the relationship between any two variables, not just stocks. It's commonly used in fields such as finance, economics, psychology, and more.
About Correlation
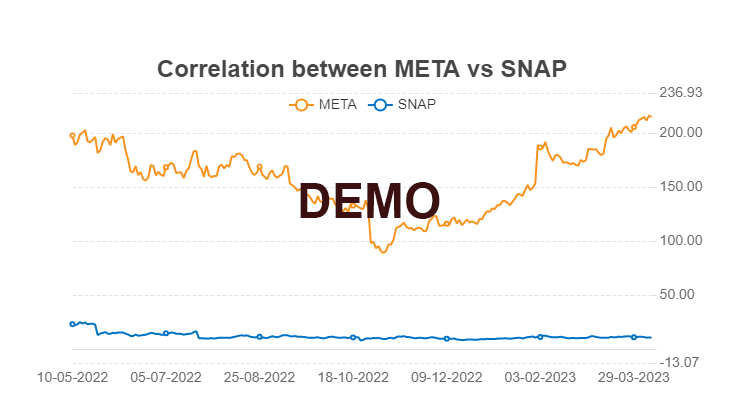
Our stock correlation tool is designed to analyze the historical price data of various stocks and calculate their correlation coefficient. This coefficient measures the degree to which two stocks move in relation to each other.
By understanding the correlation between two stocks, traders can determine if they have a positive correlation (move in the same direction) or a negative correlation (move in opposite directions). This information can be used to identify pairs of stocks that are highly correlated, allowing traders to diversify their portfolio by investing in stocks from different industries or sectors.
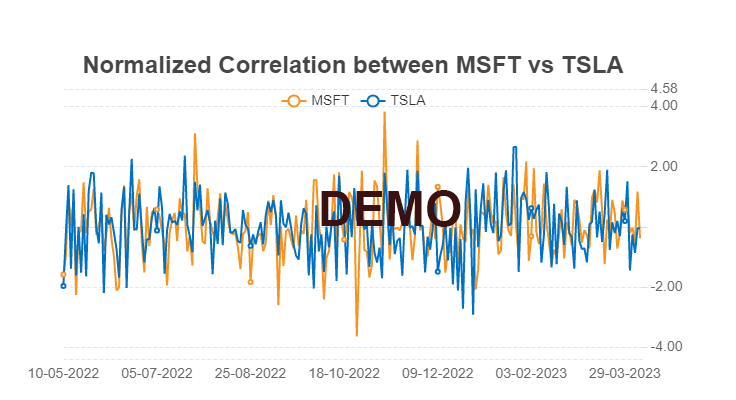
In addition, traders can use the correlation coefficient to hedge against market volatility by identifying stocks that have a negative correlation with their existing holdings. This way, if one stock in their portfolio experiences a sudden price drop, the other stock will likely rise, minimizing losses.
Overall, our stock correlation tool provides valuable insights for traders looking to optimize their portfolio and make informed trading decisions. By understanding the correlation between different stocks, traders can make informed decisions about which stocks to buy, sell, or hold in their portfolio.